External merchandise trade in Georgia Jan-Aug 2020
By Natalia Kochiashvili
Tuesday, September 22
The National Statistics Office (Geostat) released the preliminary data for the foreign trade turnover in the first 8 months of 2020. According to the information, in January-August 2020 the external merchandise trade of Georgia amounted to $7 022.8 million, 16.7 % lower to the same period of 2019. The exports equaled $2 071.4 million (14.7 % lower), while the imports stood at $4 951.4 million (17.5 %lower). The negative trade balance was $2 880 million in January-August 2020 and its share in external trade turnover constituted 41%.
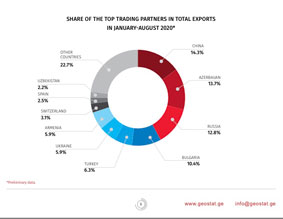
The share of the top 10 trading partners by exports in the total exports of Georgia amounted to 77.3%. The top partners were China ($ 296.6 million), Azerbaijan ($ 284.3 million), and Russia ($ 266 million).
As for the imports, the share of the top trading partners in the total imports of Georgia amounted to 69.9%. The top partners were Turkey ($ 840.7 million), Russia ($ 554.6 million), China ($ 440.9 million), the United States ($345.4 million), and Azerbaijan ($309.5 million).
Turkey remains Georgia’s largest trading partner with $970.3 million in January-August 2020, followed by Russia, China, Azerbaijan, and Armenia with $820.6 million, $737.4 million, $593.8 million, and $385.6 million, respectively.
China tops the list of largest trading partners by exports with $296.5 million, followed by Azerbaijan, Russia, Bulgaria, and Turkey with $284.2 million, $266 million, $216.3 million, and $129.6 million, respectively.
In January-August 2020 copper ores and concentrates reclaimed the first place in the list of top export items, equaling $462.1 million or 22.3 % of total exports. The exports of motor cars totaled $260.1 million and their share in the total exports amounted to 12.6%. The Ferro-alloys exports are in third place with $145.5 million and constituting 7% of the total exports.
The top import commodities in January-August 2020 were motor cars whose imports equaled $481.6 million (9.7 %of the total imports). The petroleum and petroleum oils followed in the list with $325.1 million or 6.6 %of imports. The Copper ores and concentrates were third in the top import commodity list with $312.1 million (6.3 %of imports).


